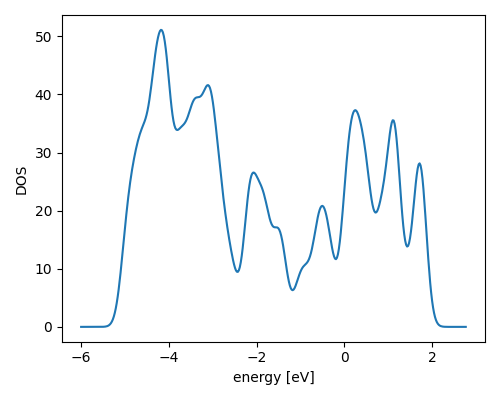
Density of states#
Example:
calc = ...
dos = DOS(calc, width=0.2)
d = dos.get_dos()
e = dos.get_energies()
You can plot the result like this:
import matplotlib.pyplot as plt
plt.plot(e, d)
plt.xlabel('energy [eV]')
plt.ylabel('DOS')
plt.show()

Calculations involving moments of a DOS distribution may be
facilitated by the use of get_distribution_moment()
method, as in the following example:
from ase.dft import get_distribution_moment
volume = get_distribution_moment(e,d)
center, width = get_distribution_moment(e,d,(1,2))
More details#
- class ase.dft.dos.DOS(calc, width=0.1, window=None, npts=401, comm=<ase.parallel.MPI object>)[source]#
Electronic Density Of States object.
- calc: calculator object
Any ASE compliant calculator object.
- width: float
Width of guassian smearing. Use width=0.0 for linear tetrahedron interpolation.
- window: tuple of two float
Use
window=(emin, emax). If not specified, a window big enough to hold all the eigenvalues will be used.- npts: int
Number of points.
- comm: communicator object
MPI communicator for lti_dos
- ase.dft.dos.linear_tetrahedron_integration(cell, eigs, energies, weights=None, comm=<ase.parallel.MPI object>)[source]#
DOS from linear tetrahedron interpolation.
- cell: 3x3 ndarray-like
Unit cell.
- eigs: (n1, n2, n3, nbands)-shaped ndarray
Eigenvalues on a Monkhorst-Pack grid (not reduced).
- energies: 1-d array-like
Energies where the DOS is calculated (must be a uniform grid).
- weights: ndarray of shape (n1, n2, n3, nbands) or (n1, n2, n3, nbands, nw)
Weights. Defaults to a (n1, n2, n3, nbands)-shaped ndarray filled with ones. Can also have an extra dimednsion if there are nw weights.
- comm: communicator object
MPI communicator for lti_dos
- Returns:
DOS as an ndarray of same length as energies or as an ndarray of shape (nw, len(energies)).
See:
Extensions of the tetrahedron method for evaluating spectral properties of solids, A. H. MacDonald, S. H. Vosko and P. T. Coleridge, 1979 J. Phys. C: Solid State Phys. 12 2991, doi: 10.1088/0022-3719/12/15/008
